Showing posts with label La Nina. Show all posts

Monday, April 11, 2011

Concerned about damaging severe weather Friday-Saturday

It has been interesting trying to figure out what form the amplification signal provided by the March 31 and April 1 surge in the SOI.  Finally there is some model agreement on a scenario that I think fits the current climate's tendency for wild weather events.

An intense storm system is expected to deepen over the central Plains and move NE dragging both upper level cold and a strong frontal system through our region. It is bad enough that a cold front is going to ram into unseasonably warm air.  Upper level cold enhances probabilities of hail, damaging wind, and tornadoes.

Here are 2 projections of what could happen in the Friday evening - Saturday time frame:

  • GFS - Depicts a deepening system headed to the Great Lakes with a negatively tilted, trailing front which would bring the biggest risk of severe weather to VA and points north.


  • ECMWF - Storm follows a track just south of the Great Lakes to the NE US.  This scenario has more cold air behind it.
We will need to keep an eye on the situation this weekend.  Another update will occur as we get closer to the event.

Saturday, April 9, 2011

Spring Bowling Ball ready to strike Central NC-Southern VA

WeatherBell Analytics Meteorologist Joe Bastardi introduced me to a term that best describes a cut-off pool of cold air caught in a low pressure system which is a frequent occurence in Spring, especially during La Nina years.  These systems bring sharply colder temperatures and strong to severe storms as they roll through. Joe calls them "Bowling Balls".

The current bowling ball brought thunderstorms last night then highs in the mid to upper 50's, 20 degrees colder than yesterday.  Now the system is about to hit us from its backside with strong to severe thunderstorms along its warm front!  Take note of the systems comma shape.
Bowling Ball system is cutoff from the jet stream
Source: Univ of Wisconsin SSEC

Thunderstorms early in the evening will feature areas of heavy rain.  Later tonight those in the paths of the frontal storms may see high winds, risk of downpours,hail, and tornadoes.  One storm near Charlotte, NC is showing tornado characteristics.

Current Radar shows the severe thunderstorms in SW NC and areas of moderate to heavy rain/thunder moving through Central NC and Southern VA.  Fortunately Richmond appears to be too deep in the cool pool to get more than rain.  The whole bowling ball is moving SE.
National Weather Service Radar shows storm system
moving SE.  I am concerned about the "tail" on the south and
rear quadrants.  Those areas are experiencing severe weather.
I will send a general alert later this evening if the severe quadrant becomes likely to affect the Triangle/NC or the Richmond area.

Monday, April 4, 2011

Super high SOI signalling dramatic weather ahead?

The Southern Oscillation Index is based on the difference in surface pressure between Darwin, AU and Tahiti related to the tendency up or down.  Negative numbers and/or falling tendency signals a progressive (west to east) weather pattern.  In this case the index soared to 74, the highest I have seen, signaling an amplified (north-south) and often a blocked pattern.  The chart below shows that this occurred on April 1st. 
SOI soars to 74 on April 1st
Data Source: The Long Paddock
Computer models are showing no specific events today here in Central NC and VA on April 14-15.  This is not a surprise as models have been simply terrible through this La Nina episode.  I think that the GFS shows an interesting intense storm in the Plains that would be a headline maker if its true.
April 14 GFS - Very cold airmass dominates the east.
Count the number of sub 1000mb storms on the map!

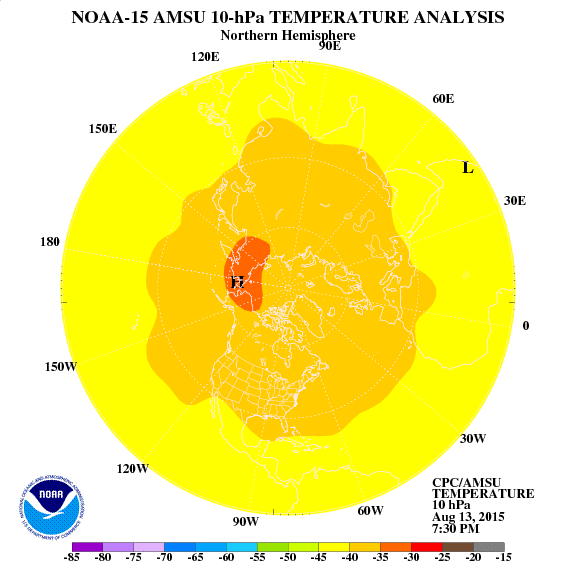
One clue that the cold air mass affecting the east beginning at the middle of this month has a lot of merit is the strong warming event in the Stratosphere advancing from Siberia to the Pole.  Such an event acts like a plunger pushing arctic air into the middle latitudes.  Unfortunately cold air surging into the the typical gyrations of spring further south is a recipe for severe storms, frosts, and freezes.
Sudden Stratospheric Warming (SSW) advances toward the Pole.
Source: NOAA Climatic Prediction Center

So, interesting days lie ahead.  You can definitely that I will be paying close attention to weather developments and will keep you informed.

Sunday, March 20, 2011

Winter 2010-11 Roundup Part 2

The question I am most often asked is: Why was everybody wrong about how cold it was going to get?   It is a very fair question because when a person hears the term La Nina and lives in the east the expectation is that most of the season will be mild and dry.  As discussed in part 1, La Nina had far less to do with the winter than the Arctic and North Atlantic Oscillations.

I have a theory based on the late 1970's Ice Age winters that hurricane paths have some correlation to the winter weather pattern.  Last summer's hurricanes roamed the east and Central Atlantic.  There were some impacts on Canada but otherwise out to sea.  Much like Summer 1978. Below is the summer 2010 tropical storm tracks:

Note the paths of long-lived major hurricanes in the West Central Atlantic.

The idea is that the storms carve up the high pressure ridges when tend to dominate the Atlantic by feeding King TUTT (Tropical Upper Tropospheric Trough).  The result is a tendency for low pressure in the Atlantic.  Add the tracks to westerly upper level winds in the tropics (West QBO) and favorable conditions for Negative NAO's and the result is a long lived low pressure region which then leads to cold arctic air flows from the land towards the system.
Image Source: Plymouth State Weather Center.
Upper level westerly winds in the tropics and easterlies in
the high latitudes combine to promote a low pressure area.


Fortunately by mid January the -NAO process began breaking down and pattern became milder (for NC and VA) but there were 2 very serious central US storms and historic Arctic outbreaks.

Now that Winter 2010-11 is now history we appear to continue to be set for a moderate summer which contains serious east coast hurricane threats.  My Summer 2011 preview will be coming soon.

Wednesday, March 9, 2011

Winter 2010-11 Roundup Part 1

For the second winter in a row persistent cold was the story for Central NC and VA.  Who would have ever thought that a La Nina winter with one of the highest 90 day average SOI would be opposite of the historical correlation to US temperatures?
Would you believe that Florida experienced its #10 Coldest winter?
It was supposed to be toasty warm!  Source: NOAA ESRL

Here is how the states ranked in temperature.  Amazingly, only Maine and Utah were above normal!
2009-10 was a strong El Nino and FL hit its record coldest.
This year featured the opposite, strong La Nina.  FL still in top 10 coldest!
Did La Nina impact the east at all?  Pervasive dryness dominated the same regions which were most cold.  A dry winter is expected during a La Nina.
Note the divergence between highest precip (in NW)
and coldest temperature relative to norms in SE.
Finally,  here are some slides showing the dominance of cold in December in the east and a progression toward a more typical La Nina pattern by February. Part 2 will include ideas about what made this past winter unique.  I will also include highlights and lowlights or the season.

Saturday, February 5, 2011

Before the warm comes terrible cold and storm!

The buzz about the potential for a east coast winter storm has become a rumble.  After the Dec 26 computer model debacle I have kept a healthy scepticism as La Ninas often feature "phantom snowstorms" in projections. 

Deep snow and terrible cold from Mexico through the Great Lakes was last week's big story.  My friends in Chihuahua, MX received a rare snowfall which covered the roads and temperatures reaching -1 F and a Thursday high of only 23, 42 degrees below the 65 F average high!  New Mexico and South Texas were heavily impacted by similar cold which drained power and natural gas supplies to critical levels requiring rolling blackouts and gas pressure outages.  Imagine temperatures near 0 and no way to heat your home!  Power and gas outages also impacted northern Mexico in a similar fashion.

It appears that Old Man Winter is in a foul mood and is set to target the East with a POTENTIAL monster storm and another serious drainage of Arctic air.  The only good news that can come from such an extreme event is how the high pressure which pushes the dome of cold air into our region often stalls in the south and warms up!  My confidence is very high that the days around Valentine's Day will be warm ... the only threat to 60+ highs being reduced if heavy snow is included with the cold.

One of my key tools which correlates very well to dramatic weather is the daily Southern Oscillation Index (SOI).  In my opinion the 2 day crash to slight negative readings on Jan 26-27 which is both preceded and followed by much higher values is a big warning that the tropics plan to participate in the event. 

Here is a European Model forecast which IF CORRECT would lead to a serious winter storm for the entire east coast.  I have added some notes to the forecast.  As usual, the exact track of the storm means everything.  Whoever ends up in the snow zone will get buried. Local Meteorologist Allan Huffman commented today that extreme projections include a 1-2 foot snowstorm followed by low temperatures near 0.
A ECMWF Perfect Storm
The upcoming week will likely be very busy.  Please expect to have your hopes and fears really stretched by computer models which go back and forth with all kinds of storm and cold projections. 

Monday, January 17, 2011

Will it Snow on Friday?

There is some buzz about the potential for a late week snowstorm.  My title has a question mark on purpose because the method of storm delivery is not one that is frequently successful in dropping real snow.  While this winter is certainly not a stereotypical La Nina it does feature the phantom snowstorms and systems which explode in one area but skip another in its path which drive all of us NUTS!!!

IF some model output has merit then an area of low pressure will form along a cold front and move up the coast spreading snow to inland NC and potentially VA.  Here is GFS output from Plymouth State Weather Center.
A pretty decent 5-7" of Snow!
So how does this stack up with reality?  I have big concerns about either the quality of US Models and/or the data being entered into them.  How are we to know if the idea of a storm has merit?

Relative Atmospheric Angular Momentum in the Northern Hemisphere continues to favor high latitude blocking (green and blue) and a southern jet stream in the mid-latitudes (yellow).  Recently momentum has been on the rise particularly in our region's latitude.  This suggests that fronts and storm systems progress more rapidly west-to-east compared to points further north.
Source NOAA Earth Science Research Laboratory
The chart looks ominously like 2009-10!

   AAM is a reanalysis from 3 days ago.  Therefore we have no guarantee that momentum will still be rising late this week which would sweep the storm out to sea.  The European model (ECMWF) seems to believe the system will be much further east.
The low over Florida would move quickly east in this Scenario.
My conclusion is that the question of whether it is going to snow later this week will not be answered with much confidence tonight.

Sunday, December 26, 2010

Historic Boxing Day Storm still in progress

After straining to tie the 1947 Christmas Snow record of 0.4" the much advertised and maligned storm system proceeded to dump 6-8" here in Central NC.  It appears on track to finish with similar totals in Central VA.

National Weather Service Radar shows the expanding shield of precipitation along the eastern seaboard.  The storm is deepening rapidly and will bring Blizzard Conditions to the Northeast by this evening.

Boxing Day Snowstorm off the NC Coast. 9:15 AM Dec 26, 2010
  Satellite images are impressive.  Note the well defined jet streams phasing off the east coast.  The storm has a great deal of similarity to the legendary Jan 24-26 "Carolina Crusher". Here is a water vapor image from Univ or Wisconsin SSEC.
Jet Streams merge into the Boxing Day Storm
The snow will give me a grand opportunity to make adjustments to long range forecasts for January (BRRR) and February (AHHH). I highly recommend reading Larry Cosgrove's WEATHERAmerica newsletter which includes a brillian analysis of climate patterns which managed to trump the mild forces of La Nina.

Wednesday, November 24, 2010

Winter 2010-11 Outlook Part 2 - What to expect

The base state of the atmosphere is expected to feature, a NW US trough which expands to the Great Lakes, and a storm track which is primarily west of the Appalachians toward the Greak Lakes.   This leaves the SE US in what is most often a mild and dry sector.  This prognostication is based on the Ocean temperature anomalies:
Ocean Sea Surface Temperature Anomalies
  1. La Nina - Cold water along the equator encourages buildup of high pressure and a subsequent slowing of Global AAM along the equator.  As a result warm high pressure is favored southeast of mountain ranges and continents.
  2. East Pacific Oscillation Zone - Positive state is favored. High Pressure NE of Hawaii favors a trough and subsequent stormy weather in the NW US.
  3. Cool Ocean near SE US - Favors stable surface high pressure.
  4. Warm near Darwin AU - Darwin downpours are great for those who want to play golf and other outdoor sports near the eastern seaboard and south of the Mason-Dixon line.  This can change quickly!
  5. The North Atlantic Oscillation Zone - The ocean favors a positive base state (mild and dry SE US) BUT there are influences which are in play to cause potential trouble. 
      Therefore we are in a situation where much of a winter will be warmer than average and dry.

Now for the interesting part...
     Winter 2010-11 will be remembered for its events not for being consistently miserable like last year.  I am deeply concerned that January's "Bear Market Rally" when the North Australia rainy season comes to an end has tremendous potential for bring destructive weather to our region.  La Nina's are well known for volatility because of the terrible cold which is often dammed up north of the jet stream.  There comes a time that imbalances must be satisfied.  The legendary snowstorm of January 2000 is an extreme version of a breakout event.  In other seasons like this one severe thunderstorms and tornadoes strike in January when they are least expected.  January 2008 featured a 4 day historic Tornadic outbreak.  The 1996 January Blizzard paralyzed the whole eastern seaboard.

     Unlike 2007-08 when I predicted very little winter at all the hurricane paths, evidence that La Nina has already hit bottom, volcanic activity, a subtropical jet stream (unusual for this weather pattern), and continued low solar all seem to indicate that this winter for Central VA and NC is one with a great deal of potential to be remembered for its misbehavior for a long time.

Friday, October 15, 2010

Signal from down under may be a weather warning

My favorite Fall and Winter tool is following the antics of the Southern Oscillation Index (SOI).  During the fall following rises and falls can be useful in anticipating the moveme

Strong positive readings have dominated since the summer.  Such values are indicative of a La Nina circulation featuring blocked weather patterns and enhanced North Atlantic and West Pacific tropical activity.  Here in NC and VA we can thank the circulation for summer's endless heat.

Recently there was a nosedive in the index which also was part of the rise in global AAM and burst of equatorial westerly winds noted earlier this week.  The dip and steep rise indicates the likelihood that the surge of momentum will come to a screeching halt near the SE around Oct 28.  This kind of pattern usually is a great warning of an extreme or unusual weather event.  My suspicion is that a strong cold front and possibly interaction with a storm system will complete the destruction of summer.
Data Source: The Long Paddock

Monday, October 11, 2010

Atmospheric "Bull Market" signals more extreme weather

Important Reference: Putting a Spin on the Earth's Weather

El Nino's grand collapse this past spring into a dominant La Nina pattern was very similar to a Stock Market Crash in terms of the mayhem caused worldwide.  Weather patterns literally locked in place causing some of us to roast, others, to shiver, and areas like Pakistan to drown in rainfall.  An extremely interesting aspect of this La Nina was the global lack of hurricane production.  Even though the Atlantic was well above average the total cyclone production as calculated in terms of Accumulated Cyclonic Energy (ACE) is at a 33 year low.

Global AAM just got a boost as mountain ranges are literally moving weather systems along in the deep tropics.  Far to the north blocking high pressure formation is being promoted.  This development is very important for 2 reasons:
  • A destruction of the repetitive heat ridge which caused suffering in the US Southeast. Summer will soon be OVER.
  • Easterly flow to the north combined with westerlies to the south encourage storm formation.  We need to be on the lookout for a Nor'easter or tropical hybrid which brings wind and rain to the east.  Another big reason to watch for a big storm is the coming of the NC State Fair!
This pattern looks like last winter.
Source: NOAA Earth Science Research Laboratory.


 Compare the above image with the one below which I saved from this past winter.  Keep in mind that the Winter's biggest story was the -AO mega blocking pattern which sustained cold more-so than the El Nino.
Winter 2009-10 featured fully developed versions of
blocking in the North and a subtropical jet to the south.
Source: NOAA Earth Science Research Laboratory.

     The GFS Model does forecast a blustery frontal passage for Thursday,  Just in time for the start of the NC State Fair.

That's not "Fair"!!!
Source: NOAA Air Resourced Laboratory


     The last GFS Model Output needs to be interpreted in terms of overall theme.  Models at the Day 10 level can be notoriously wrong   The scene depicts a heavy rainstorm ahead of an incoming strong cold front that washes the NC State Fair away.  I think something like this is coming BUT will need to tweak the timing as actual weather systems appear on the map.
More of "That's not Fair"?
Source: NOAA Air Resources Laboratory

         Could this kind of a weather pattern repeat during the upcoming winter?  I am finding that Autumn events seem not to correlate very well with the following season.  The picture that God is painting through the transition of Fall does shine some light in terms of the overall theme of the events and measurable impact on the global circulation.

Friday, October 8, 2010

Summer 2010 Roundup

Hottest on Record!

Is it possible to complain enough about this past summer?  In addition to being the hottest on record I cannot remember a summer season which featured such long stretches of extreme heat with no relief! For your reference here was my Summer 2010 and Tropical Outlooks.

The idea of large scale land based blocking patterns was easy derived.  It was challenging to figure out that NC and VA would be in the heart of the heat wave as I oscillated between the idea of a cool and hot summer last spring.  The final result was hotter than my very uncomfortable idea of 2-3 above average.


Source: National Climatic Data Center
It is easy to see that the areas specified as being hot were really close to being correct. It would have been great to have been more accurate about the heat BUT warnings of long hot and dry stretches during the season was a great description.

A Drought which mathematically did not happen

Rainfall amounts were near 69% of average at the airport.  I must point out that RDU was a bit dry (.47") on August 24th when the Garner, NC Weather Station reported 4.77"!  So even though overall we were nearer to average than a drought the oppressive heat and long dry periods led to a gardening season which was extremely challenging.  My end of summer flooding concerns were certainly vindicated by the near 6" deluge at the end of September.  On a national scale there was no dominance of drought when total rainfall was considered.


Source: NOAA Earth Science Research Laboratory

Tropical Storms gobbled up by King TUTT

Persistent low pressure in the Atlantic combined with persistent upper level SW flow led to a season which started quietly before EXPLODING in late August.  Here is the Unisys site showing the storm tracks.  Earl was closest to NC as he passed just offshore of Cape Hatteras as he was weakening from a Cat 4 to a 2!  He illustrated my concern that storms that would fail to stay far out to sea would be monsters.  Florida avoided a big hit (so far) and Earl was our closest brush to a major hit.

Therefore the dominant storm tracks and expectation of a late starting season was very correct.  Risk to Florida has not yet materialized and may not...  Earl was wide right of Cape Hatteras.  My projected number 12 was low as the storm total is 15 (even though Bonnie, Colin, Gaston,  and Nicole were pretty lame classifications).  I admit that my 12 number included a couple of named storms by the Tropical Prediction Center which would be questionable.


Summer by the numbers (RDU)

Source: National Weather Service
  • Ave temperature, 81.7 was a scorching +5.1 anomaly, record hottest!!!
  • At 92 the average high temperature simply unbelievable.
  • Rainfall was 69% of average. 8.06"
  • Cooling degree days reached an EXPENSIVE 1555 which was 50% aboverage average.
  • Counting was difficult.  It appears that 8 Record high minimums were set and 3 record highs.  It was amazing to observe mid to upper 80's as late as 11PM across the area on several occasions.
I am extremely glad that Summer 2010 is now history.  In 42 years of life I cannot recall suffering so much in one season.  It was no fun to be outside hardly at all.

There was one benefit to the awful summer.  Every other day was Christmas on the Cayenne bush!

Wednesday, October 6, 2010

Winter 2010-11 Preview - Did La Nina just hit bottom?

The most frequently asked question to me during the past few weeks is about what to expect this winter.  2009-10 was extremely cold and in some parts of the deep south the coldest on record.  Among the biggest concerns of questioners has been related to whether that level of cold will repeat this year.
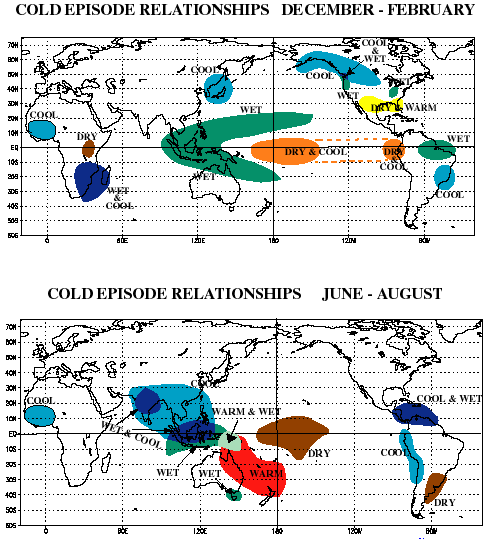
Often the focus each winter is the state of the El Nino/La Nina Southern Oscillation (ENSO). Many of you know my annoyance at mainstream forecasts which display a map like the one below and walk away believing that the public has been served.   Ladies and Gentlemen, it is often stated "The Devil is in the details".

 
Stereotypical La Nina Relationships
Source: Wikimedia Commons

Here is a detail, which if it becomes true will make a huge difference between a stereotypical mild and dry winter for Central NC and VA and something much different.  When La Nina's effects on global circulation reach a bottom in mid or late season then the "boring" winter usually wins.  What happens if the bottom is reached during the preceding autumn?  Did this La Nina episode just do that?


Source:  Earth Science Research Laboratory
In addition to a probable early bottom of La Nina we must also factor in the ongoing extended period of low solar activity. While sunspots and solar flux have risen above the doldrums of the long minima between cycles 23-24 it has not risen much at all. Based on historical evidence of low solar activity correlating very well with extreme weather and cold winters there is concern that if the sun does not return to higher levels of activity that another Ice Age could develop.

Extreme winter events in the Southern Hemisphere is a cause of concern. There was the massive cold wave which swept South America.  The cold devastated fish populations, livestock, and killed people.   Snow and sleet was observed in tropical regions and the cold actually crossed the equator !  Recently spring blizzards raged in New Zealand for six days. Over 350,000 lambs were estimated to have been killed by the weather.

Another variable is the ongoing but lower level volcano activity in the high latitudes.  Such activity will certainly reinforce the propensity for blocking patterns which has caused global grief this year in the form of prolonged extreme weather.  If the Katla volcano blows its lid in Iceland then the risk of dangerous winter cold engulfing much the the US and Western Europe would rise significantly.

How do I see Winter 2010-11 based on an Autumn bottom of La Nina?
  • Overall average temperature a little colder than neutral BUT getting there by wild swings in temperatures.
  • Last year's cold was persistent and costly.  2010-11 should include shorter periods of extreme cold.  It would not surprise me if Central VA and NC experience periods of unbelievable cold with lows below 15.
  • There will be breaks in the winter action.  Keep some short-sleeved shirts handy.  Perhaps even some time to get a January tan! (70's) . But unlike last winter we will get some real warm spells.
  • Not as much persistent snow in VA.  BUT...  If one wants to roll the dice for blockbuster winter events then this is a good year to do it.  IF the weakening La Nina thesis works then there will be at least one period where arctic cold and the southern jet stream can produce a memorable or historic period of weather. 1995-1996 and 1999-2000 had seasons which appear similar to this one. I am not sure how 1935-36 might correlate.  35-36 was a snow blockbuster for our region and featured a persistent negative NAO.  That being said ...  snow in the Raleigh area is episodic, therefore cannot be predicted using statistical averages.  Our propensity for sleet and freezing rain can conceal bad winters because we do not count all frozen precipitation. 
Therefore I believe that exciting but challenging weather lies ahead.  If it is discovered that the La Nina circulation deepens further instead of weakening as winter commences then the final forecast will be kinder and gentler.